Learn --> Intern --> Get a Job
Business Analytics
Specialization training with internship experience that can get you a full-time job
4.8


Specialization training with internship experience that can get you a full-time job


Get ahead with 3 work-ex credentials under your resume and LinkedIn profile.

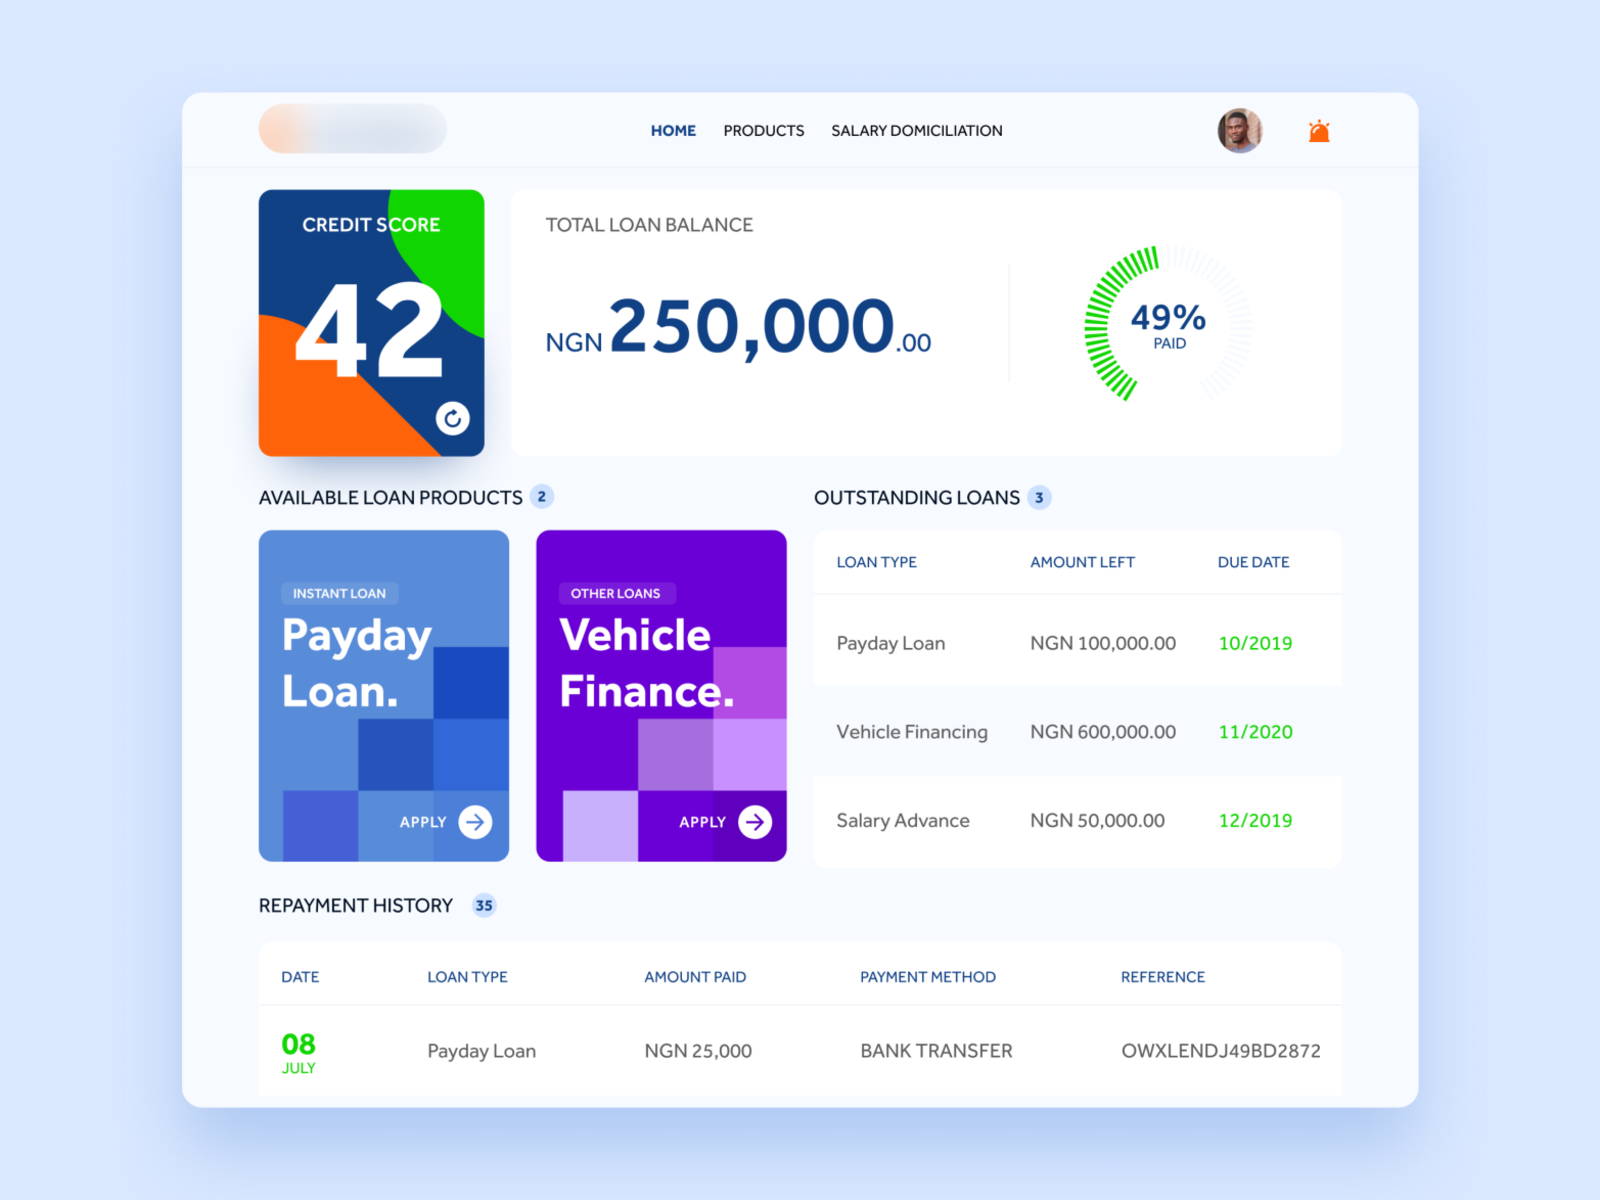
Get instructions from your team leader, learn from structured training material to work on live projects & master real industry tools.
Excel
MySQL
Tableau
PowerBI
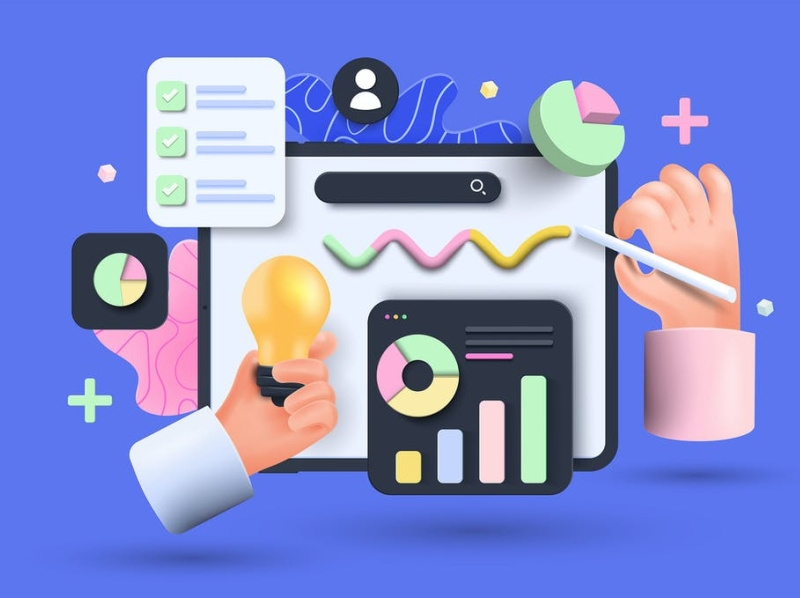
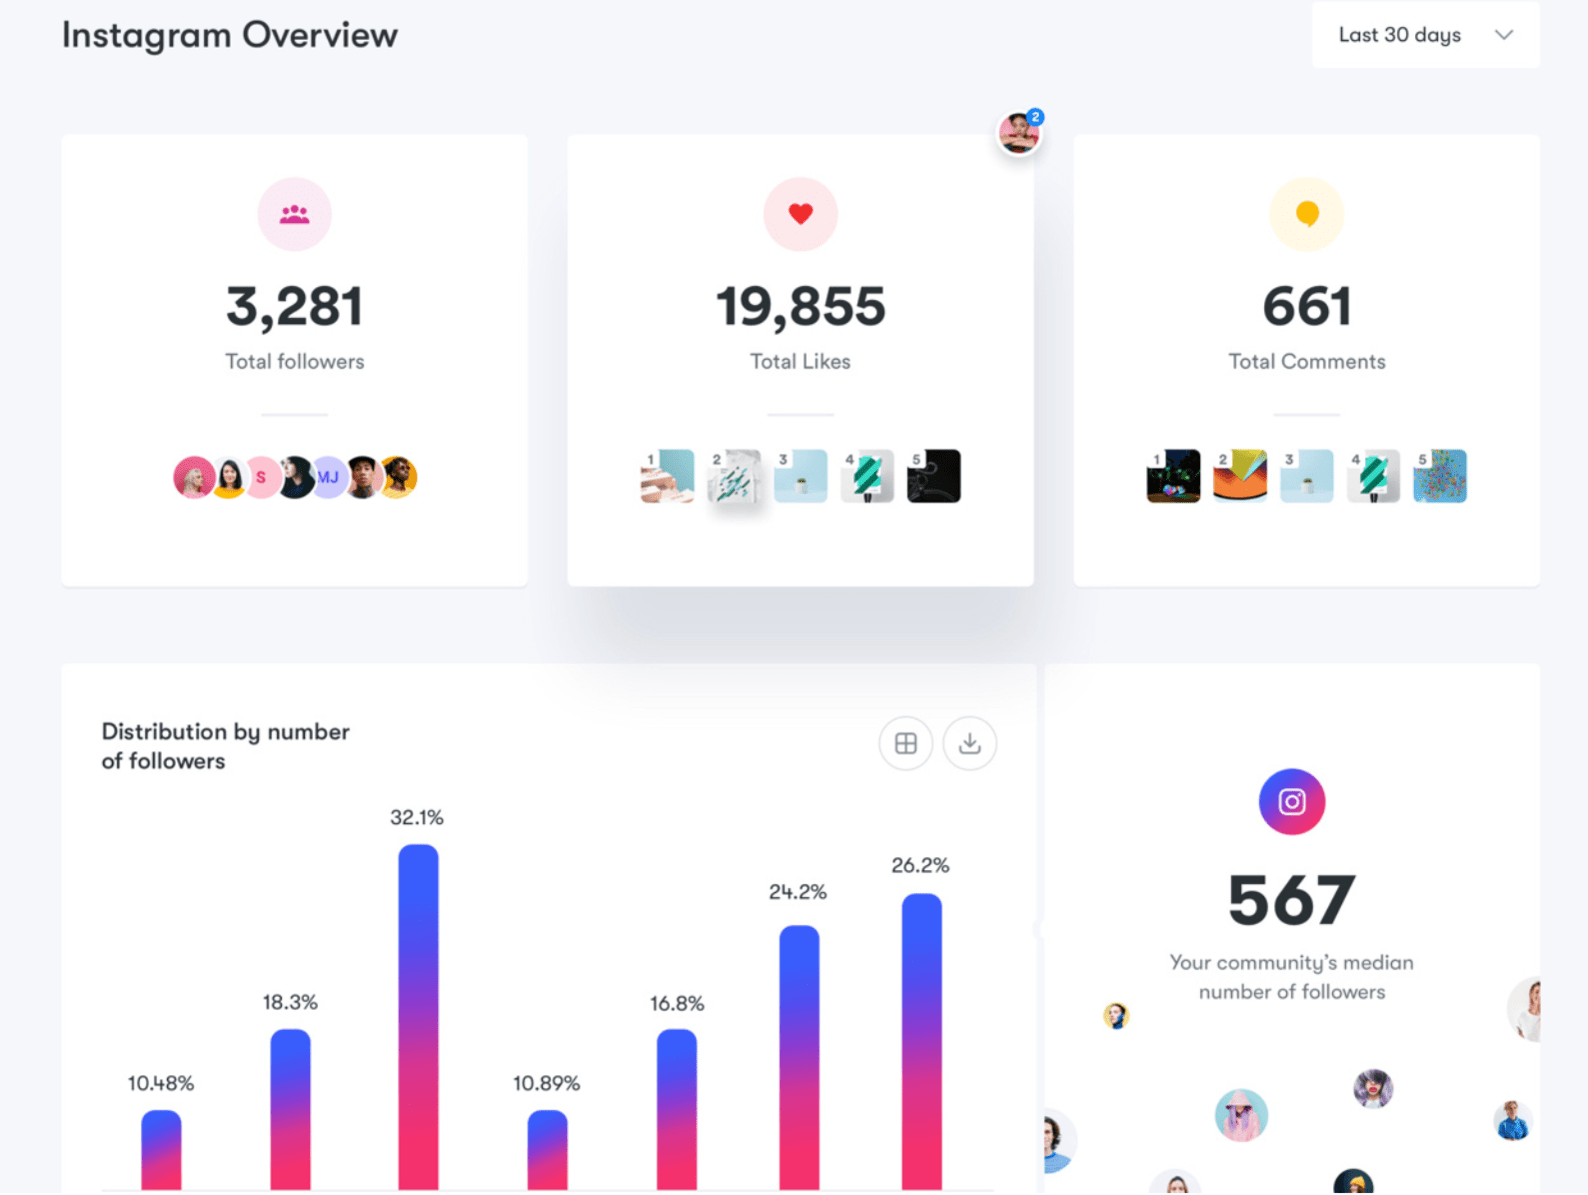
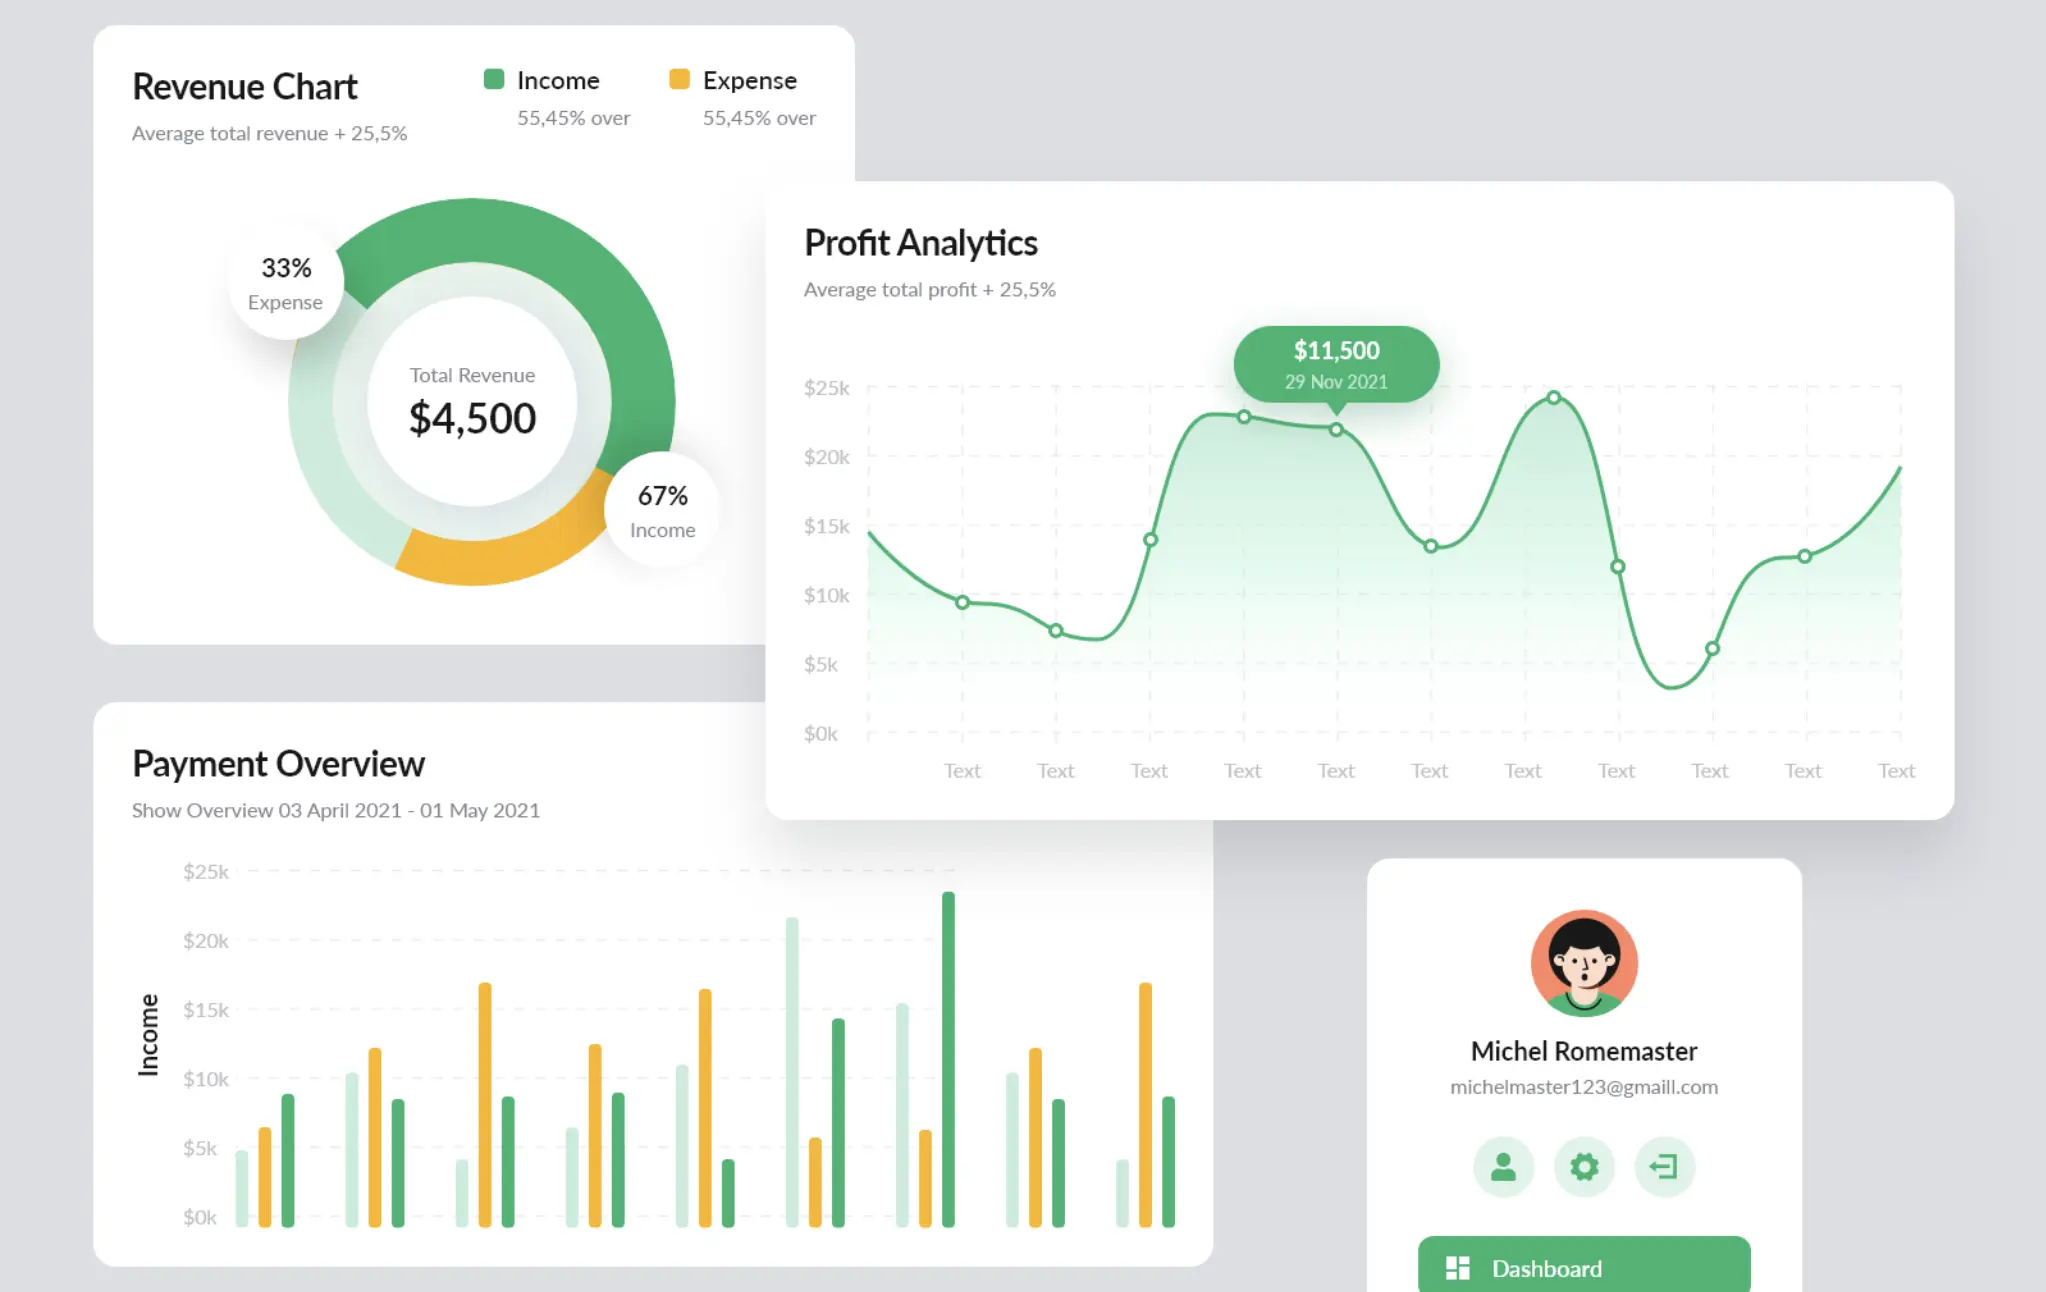
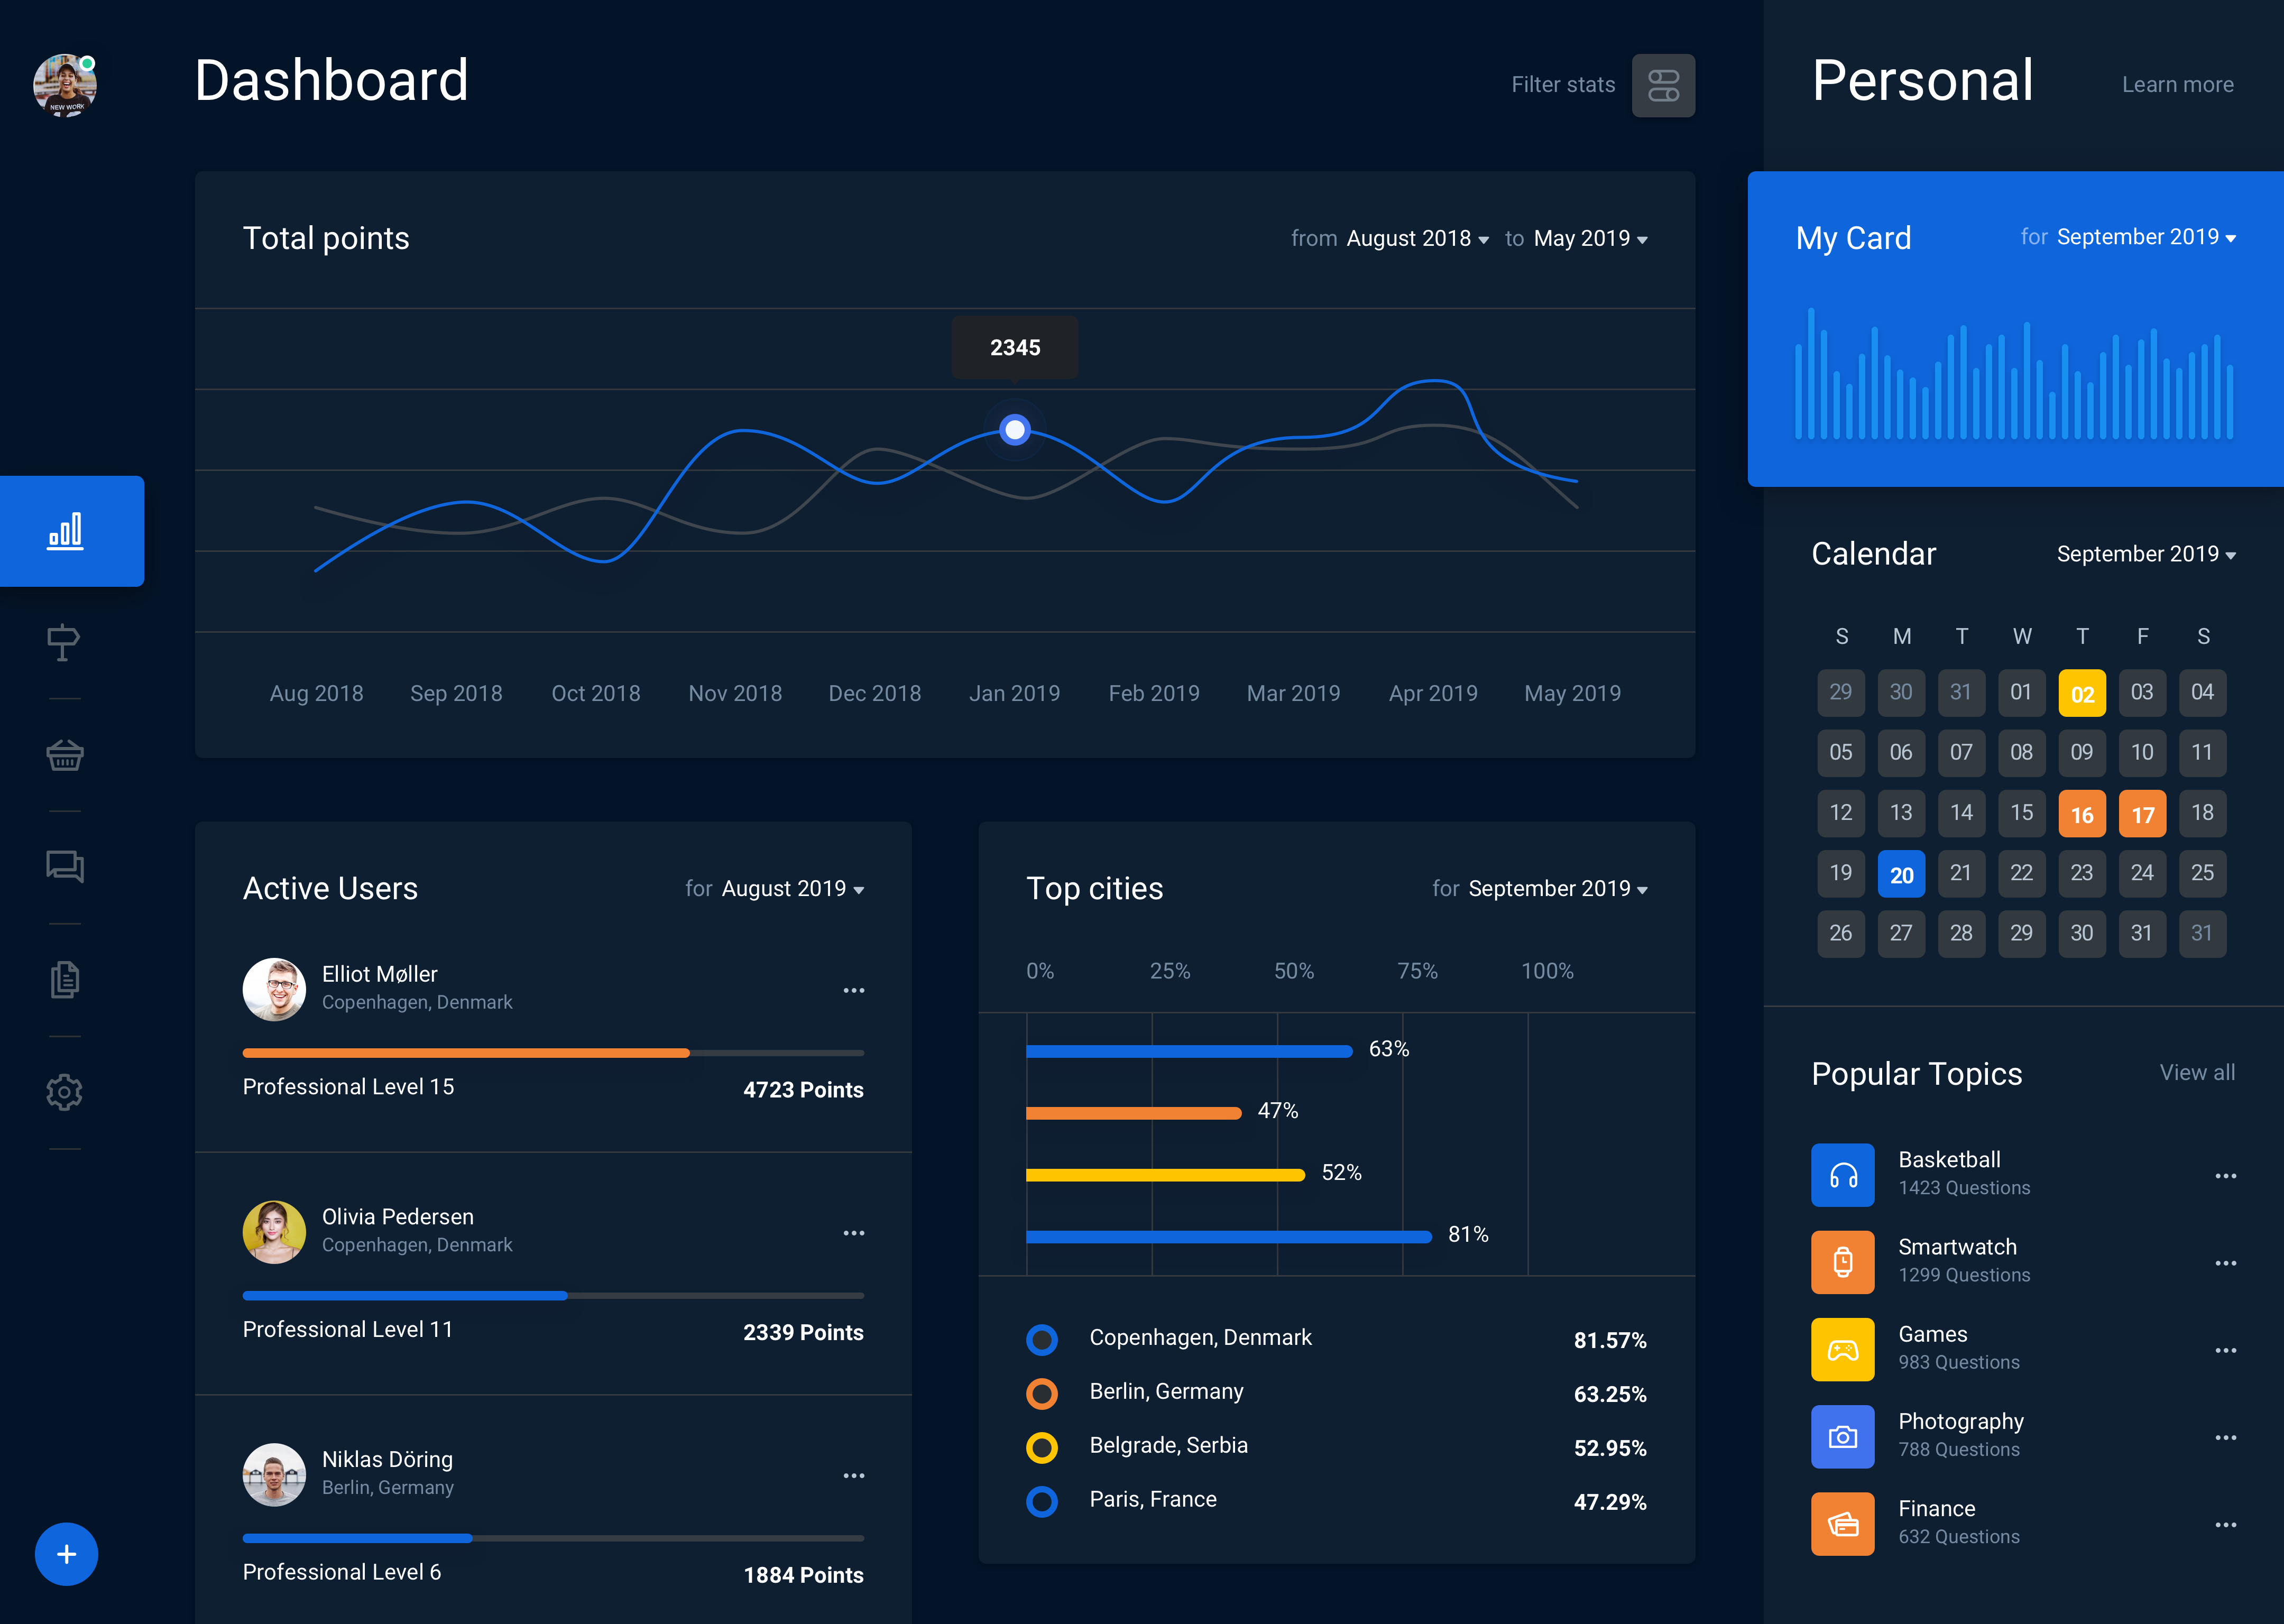
Data Visualization
Statistics
And many more...
Build real-life industry projects and showcase your portfolio & skills to employers.
Attend the launch session, Sign-up for the program and get
enrolled in Trainity's externship program for free